Bitcoin Price Prediction for Today, February 28: BTC/USD Tests $23,679 Level, What Next?
The Bitcoin price prediction bounces off the support at $23,322 as the coin moves close to the resistance level of $23,700 within the channel.
Bitcoin Prediction Statistics Data:
- Bitcoin price now – $23,645
- Bitcoin market cap – $453.3 billion
- Bitcoin circulating supply – 19.2 million
- Bitcoin total supply – 19.2 million
- Bitcoin Coinmarketcap ranking – #1
BTC/USD Long-term Trend: Ranging (Daily Chart)
Key levels:
Resistance Levels: $27,000, $28,000, $29,000
Support Levels: $21,000, $20,000, $19,000
BTC/USD is trading around $23,645 with a 0.07% gain as the coin touches the daily high at $23,679. According to the daily chart, the Bitcoin price may begin to fight to cross above the 9-day moving average as it could move near the upper boundary of the channel. However, for BTC/USD to remain above the moving averages, the bulls need to make the $23,500 support level to be strong.
Bitcoin Price Prediction: Bitcoin (BTC) Could Spike Higher
At the moment, the Bitcoin price is seen hovering within the 9-day and 21-day moving averages, if it breaks toward the upper boundary of the channel, BTC/USD could touch the nearest resistance level of $26,000. Moreover, the king coin needs to claim this important resistance level to head to the upsides; else, the supports at $21,000, $20,000, and $19,000 may likely come to play.
However, looking at the Relative Strength Index (14), the signal line is likely to cross above the 60-level, but the recovery may not come easy. Traders must be aware that support will have to be sorted above the 9-day moving average while other important resistance levels could be located at $27,000, $28,000, and $29,000.
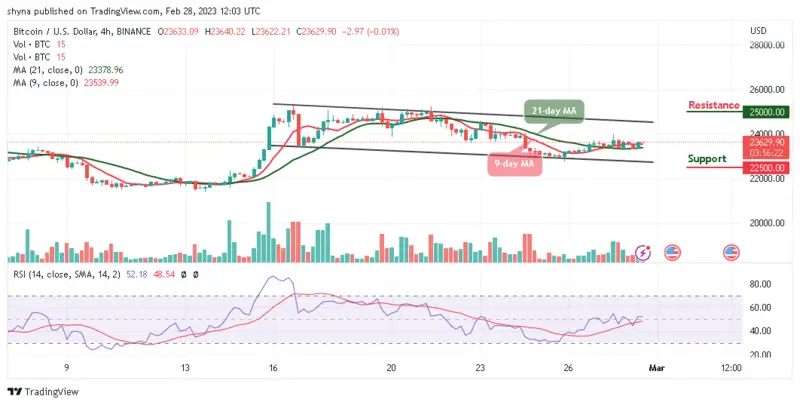
BTC/USD Medium-term Trend: Bearish (4H Chart)
On the 4-hour chart, the technical indicator Relative Strength Index (14) moves to cross above the 50-level and could head to the north to begin the bullish movement. On that note, the chart reveals that there could be a little bullish movement within the market as the technical indicator could face the upside.

However, if the Bitcoin price breaks toward the upper boundary of the channel, it is likely for the king coin to hit the potential resistance at $25,000 and above. Meanwhile, if the current market value drops below the 9-day and 21-day moving averages, it may touch the support at $22,500 and below.
Bitcoin Alternatives
The Bitcoin price is in an upward move in its lower time frame, trading at a $23,645 resistance level within the moving averages. Meanwhile, there is the possibility of more upsides as the technical indicator shows that the price action is in an upward move, so we expect the buyers to move the price up and the $25k high level may be the target in the coming days in its long-term view. However, the success of the FGHT project as a whole is another important factor to consider. The team behind the Fight Out token has a solid track record in the industry and has laid out a clear roadmap for the development of the platform. In the ongoing presale, almost $5 million has been raised.
Comments
Post a Comment