Bitcoin Rainbow chart predicts BTC’s price for Jan 1, 2024
As the year ends, Bitcoin (BTC) maintains a robust position, trading comfortably above the $40,000 support zone after lingering in a consolidated phase for the part of 2023. This upward trend is primarily fueled by anticipation surrounding the potential approval of a spot exchange-traded fund (ETF).
Looking ahead to the new year, Bitcoin’s performance will be significantly influenced by various potential bullish and bearish catalysts. Factors such as increased institutional adoption, upcoming halving event, regulatory changes, and broader macroeconomic trends will be pivotal in shaping the cryptocurrency’s trajectory.
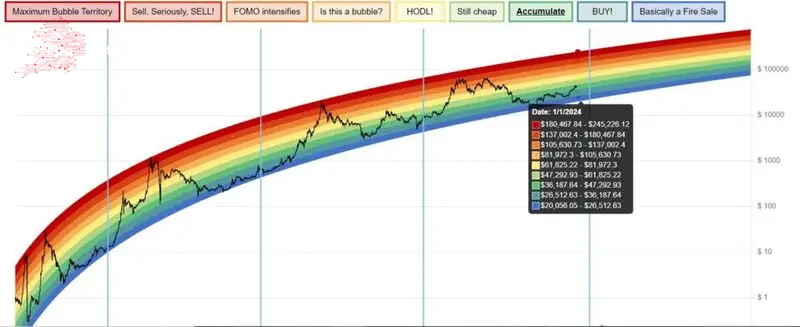
As things stand, there is overall curiosity about how Bitcoin will trade in the future and whether it will sustain the current momentum. In this line, to gain insights into Bitcoin’s potential trajectory, Finbold analyzed BlockchainCenter’s rainbow price chart—a tool illustrating the cryptocurrency’s historical movements about different moving averages (MA).
Data retrieved from the chart on December 24 indicates that Bitcoin has entered the ‘Accumulate’ phase, currently standing in the price area between $35,907 and $46,932.
Bitcoin price forecast for January 1, 2024
With 2024 on the horizon, Finbold also consulted the chart regarding the predicted valuation of Bitcoin on the first day of the new year. To provide a projection for the price, the chart utilizes a logarithmic growth curve to offer insights into BTC’s potential future price direction.
The tool overlays rainbow color bands on top of the curve to highlight market sentiment at each rainbow color stage as the price reaches it, drawing attention to bullish or bearish scenarios.
According to the chart, the best scenario for Bitcoin would be represented by the “Maximum Bubble Territory,” which is indicated by a dark red color. The band Features a possible price range of $180,467 and $245,226 for January 1, 2024.
On the other hand, according to the chart, a bearish scenario for Bitcoin would potentially see the cryptocurrency trade in the ‘Basically fire sale’ phase, featuring a price range between $20,056 and $26,512.

In the event that Bitcoin holds the current ‘Accumulate’ zone until January 1, 2024, the cryptocurrency would trade in the range of $36,187 to $47,292.
Based on historical patterns, 2024 could be a bullish year for Bitcoin. Notably, Bitcoin skyrocketed from the ‘Accumulate’ zone in September 2020 to ‘Sell. Seriously, SELL!’ zone (red) in April 2021 before correcting briefly and reclaiming the ‘Sell. Seriously, SELL!’ later that year to hit a new all-time high.
Bitcoin looks to break past $45,000
As things stand, Bitcoin’s recent rally has fallen short of breaking the $45,000 mark, a level deemed crucial for the cryptocurrency to reach $50,000. Notably, there is anticipation that the ETF will likely receive approval in January, fostering market optimism that the cryptocurrency will embark on a sustained bull run, fueled by other catalysts such as the upcoming halving event and potential interest rate reductions by the Federal Reserve.
Consequently, several analysts have shared projections on the cryptocurrency’s performance in the coming year, highlighting possible heights it could reach.
It’s worth highlighting that while the ETF is considered a potential catalyst for a rally, given its potential to attract institutional investors, not all market participants are convinced. According to a Finbold report, experts believe that the approval of the ETF might turn out to be a “buy the rumor, sell the news event.”
Bitcoin price analysis
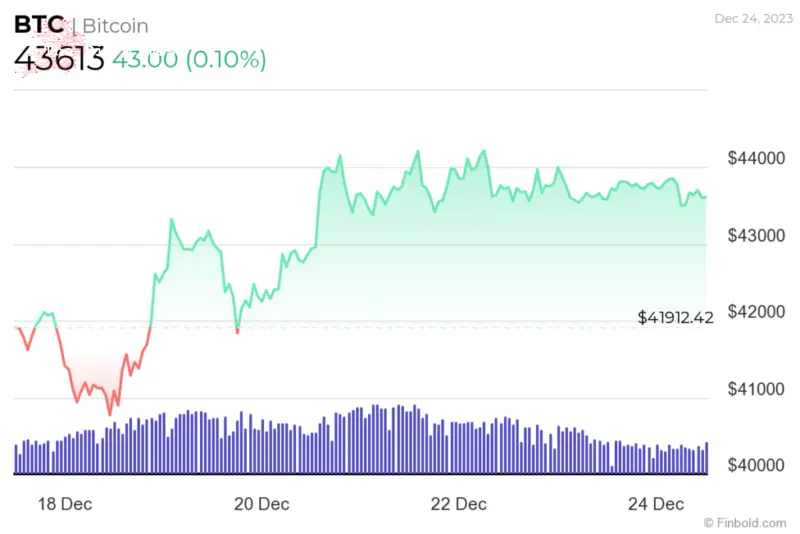
As of the current press time, Bitcoin is valued at $43,613, reflecting a rally of over 4% in the last seven days.

Simultaneously, technical indicators for Bitcoin retrieved from TradingView predominantly show bullish sentiments. A summary of the gauges suggests a ‘buy’ rating at 13, with moving averages indicating a ‘strong buy’ at 13. Oscillators lean towards a ‘sell’ rating at 3.

Overall, as Bitcoin looks to reclaim the $45,000 spot, its crucial for the asset to retain its valuation above the $43,000 mark.
Disclaimer: The content on this site should not be considered investment advice. Investing is speculative. When investing, your capital is at risk.


Comments
Post a Comment