Analyst identifies key price level to validate Bitcoin’s bullish scenario
After days of correcting that saw Bitcoin’s (BTC) valuation face the possibility of extended sell-off below the $40,000 mark, the maiden cryptocurrency has made short-term gains as it seeks to establish a sustained rally.
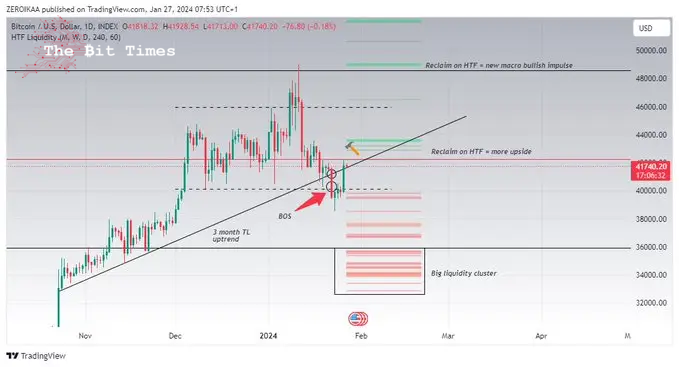
As the market anticipates the next Bitcoin move, a crypto analyst by the pseudonym IamZeroIka, in an X (formerly Twitter) post on January 27, identified a critical price level that could determine the fate of Bitcoin’s bullish momentum.
According to the expert, Bitcoin’s recent bounce, which saw it touch above $38,000 for the first time in weeks, could be a temporary uptick if it fails to surpass the $42,000 mark. He noted that breaking through this resistance level would open the door for further gains, potentially pushing Bitcoin toward $44,000 or even $46,000.
“Unless Bitcoin reclaims the 42K (HTF), this is nothing more than a lower high, in my opinion. <…> Everything below 48K can be used as fuel to recharge short positions,” he said.

However, failure to reclaim $42,000 could have significant consequences, suggesting that bears could regain control and drive the price further if Bitcoin remains below this key level.
Further emphasizing his point, IamZeroIka provided a simplified overview of the daily chart technical Analysis, highlighting three key bearish signals. Firstly, he pointed out the break of the three-month uptrend trendline, indicating a potential shift in momentum from bullish to bearish.
At the same time, he observed a break in the structure, suggesting that falling below these levels could potentially set the stage for further decline. Lastly, he drew attention to the liquidity in the $32,000 and $36,000 zone. In this regard, the zone appears to have a high concentration of buy orders, which could act as a magnet for the price if it falls, potentially accelerating the downtrend.
Bitcoin turns bullish as GBTC sell-offs slow
It’s worth noting that the recent Bitcoin sell-off came against the wider market expectations following the approval of the spot exchange-traded fund (ETF). Indeed, part of Bitcoin’s volatility was mainly attributed to outflows from the Grayscale Bitcoin Trust (GBTC).
Notably, the recent surge in the asset’s valuation has coincided with an increasing slowdown in outflows from GBTC. The consistent slowdown could suggest the start of a deceleration in redemptions.
In this context, JPMorgan (NYSE: JPM) strategist Nikolaos Panigirtzoglou suggested that the Bitcoin sell-off might be nearing an end, stating that the “GBTC profit-taking has largely happened.”
Meanwhile, BlackRock’s (NYSE: BLK) Bitcoin ETF is poised to achieve a noteworthy milestone by surpassing $2 billion in assets under management. The firm’s latest product is maintaining its dominance in the emerging category of ETFs, which is viewed as a positive sentiment for the market, considering BlackRock’s status as the world’s largest investment firm.
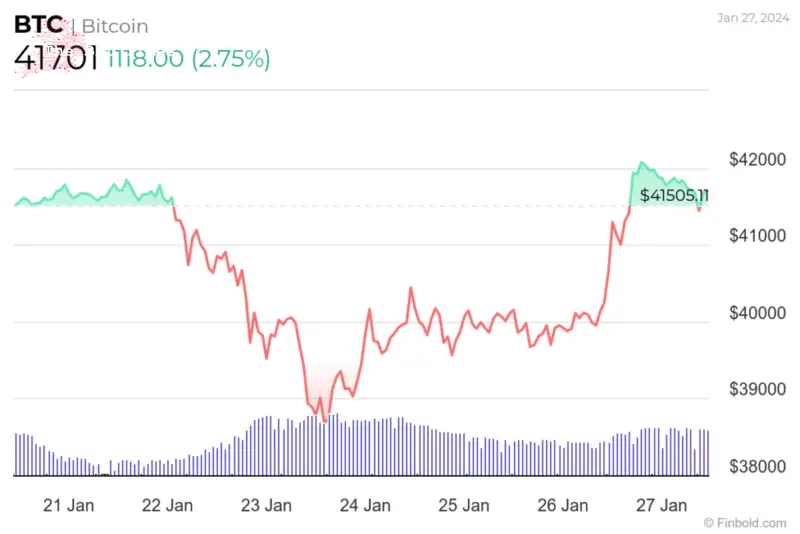
Notably, at the start of the week, Bitcoin experienced a significant decline, dropping below $39,000 for the first time since early December. Interestingly, several analysts had projected that the sell-off might extend further to the $30,000 level, and therefore, the ongoing rebound could be welcomed news for the market.
Bitcoin price analysis
By press time, Bitcoin was trading at $41,701, having recorded gains of almost 3% on the daily chart. On the weekly chart, BTC is up less than 1%.

Amid the current bullish sentiments, Bitcoin technical analysis is dominated by neutrality. The summary of the one-day gauges retrieved from TradingView recommends ‘neutral’ at 9. The same sentiment is replicated for moving averages and oscillators at 1 and 8, respectively.

In conclusion, although Bitcoin shows bullish sentiments in the short term, the asset needs more convincing to break past the $42,000 mark, which remains a key resistance zone for further gains.
Disclaimer: The content on this site should not be considered investment advice. Investing is speculative. When investing, your capital is at risk.


Comments
Post a Comment